Leaflet © OpenStreetMap contributors
Energy Proof Your Home
Enter postcode:

Littleshaw, The Lane, Fordcombe, Tunbridge Wells, Kent, TN3 0RP
Date of EPC: 1st November 2016
Detached House
Boiler and radiators, mains gas
Boiler and radiators, mains gas
Total floor area
231m2
231m2
Energy Efficiency Performance
| Feature | Description | Rating |
|---|---|---|
| Walls | Cavity wall, as built, no insulation (assumed) | Poor |
| Roof | Pitched, insulated (assumed) | Average |
| Windows | Partial secondary glazing | Poor |
| Main Heating | Boiler and radiators, mains gas | Good |
| Main Heating Control | Programmer and room thermostat | Average |
| Hot Water | From main system | Good |
| Lighting | No low energy lighting | Very Poor |
| Floor | Solid, no insulation (assumed) | N/A |
| Secondary Heating | None | N/A |
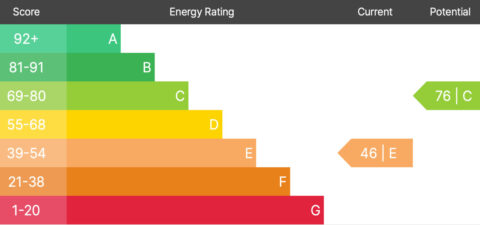
EPC Energy Ratings
| Score | Energy Rating | Current | Potential |
|---|---|---|---|
| 92+ | |||
| 81-91 | |||
| 69-80 | 70 | C |
||
| 55-68 | 56 | D |
||
| 39-54 | |||
| 21-38 | |||
| 1-20 |
Recommendations
| Improvement | Indicative Cost (Nov 2016) | Inflation Adjusted Cost† |
|---|---|---|
| Cavity wall insulation | £500 – £1,500 | £628 – £1,884 |
| Solid floor insulation | £4,000 – £6,000 | £5,025 – £7,537 |
| Draughtproof single-glazed windows | £80 – £120 | £100 – £151 |
| Low energy lighting for all fixed outlets | £140 | £176 |
| Upgrading heating controls | £350 – £450 | £440 – £565 |
| Replace single glazed windows with low-E double glazing | £3,300 – £6,500 | £4,145 – £8,165 |
| Solar photovoltaic panels, 2.5 kWp | £5,000 – £8,000 | £6,281 – £10,049 |
†figures are adjusted for inflation using Bank of England calculation
Potential Yearly Savings with Upgrades

Lighting
| Nov '16* | Now† | Saving | |
|---|---|---|---|
| Current Cost | £202 | £254 | £100 (50%) |
| Potential Cost | £102 | £128 |

Heating
| Nov '16* | Now† | Saving | |
|---|---|---|---|
| Current Cost | £1,973 | £2,478 | £364 (18%) |
| Potential Cost | £1,609 | £2,021 |
*based on average energy costs when the EPC was created (1st November 2016)
†figures are adjusted for inflation using Bank of England calculation
†figures are adjusted for inflation using Bank of England calculation
Home Electrical Improvements

Appliances
| Least Efficient | Most Efficient | Yearly Saving* | |
|---|---|---|---|
| Annual Running Costs | £441 | £154 | £287 (65%) |
| Least Efficient | Most Efficient | Yearly Saving* | ||
|---|---|---|---|---|
| Washing Machines | AEG L7FE7261BI | Hoover HW 414AMBCB/1-80 | £43 62% | View |
| Tumble Dryers | Montpellier MTD30P | Samsung DV16T8520BV | £98 77% | View |
| Dishwashers | Candy CF 6F52LNB-80 | Fisher & Paykel DD60DTX6HI1 | £47 55% | View |
| American Style Fridge Freezers | Hisense RQ5X560SFLES | Samsung RB53DG706AS9 | £51 60% | View |
| Single Ovens | Hoover HOAZ7801IN | AEG BSE782380M | £18 44% | View |
| Cooker Hoods | Rangemaster RMHDT90SS/ | Russell Hobbs RHICH904DB | £31 88% | View |

Technology
| Least Efficient | Most Efficient | Yearly Saving* | |
|---|---|---|---|
| Annual Running Costs | £147 | £39 | £108 (74%) |
*saving is the yearly difference between the running costs of the most and least energy efficient models of a typical range of products found in the home
Electric vs Petrol Vehicle

Vehicle Running Costs
| Petrol | Electric | Yearly Saving* | |
|---|---|---|---|
| Saloon | £1,778 | £927 | £851 48% |
| Hatchback | £1,268 | £816 | £452 36% |
| SUV | £1,456 | £927 | £529 36% |
| Estate | £1,494 | £1,133 | £361 24% |
*saving is the yearly difference in running costs between an electric and a petrol version of a comparable vehicle over 12,000 miles
Primary Energy Use
| Current Cost | 61677 kWh per annum* |
|---|---|
| Potential Cost | 43659 kWh per annum† |
| Decrease | 29% decrease |
*based on the primary energy use per square metre (kWh/m2).
†includes energy generated by carrying out the recommendations above
Primary Energy Use is a measure of the energy required for lighting, heating and hot water in a property. The calculation includes:
- the efficiency of the property’s heating system
- power station efficiency for electricity
- the energy used to produce the fuel and deliver it to the property